
Chart view
Chart view is a real time graph visualization of your dataset with a range of available parameters.
It is a flexible and easy to use tool for measuring and reviewing your team’s performance and project status in an in-depth manner during project curation. You also have the ability to compare data through different charts to help you visualize the information easily.
The visualization is applied to the filtered data. Filtering is done using the updated query syntax (beta).
Enable Chart view
To see the Chart view, you'll need to enable Beta in Explore, which also requires you one-time Resync of dataset.
-
Select the project you want displayed in Chart view.
-
In the left panel, click on Explore.
-
Click Beta in the top right.
-
Click Resync.
-
Click Chart view in the top right.
Charts are built by using the following setups: Measure, Breakdown, Compare by and Chart type.
Measure
Through this parameter, you can look into the different measurements of your items, such as count, time spent, and some component values. You can have multiple selections under Measure.
| Measure (y-axis) | Aggregation methods |
|---|---|
| Count | Number of items |
| Durations | [Role_Name] Time, Admin Time, Total Time Aggregation methods: Sum, mean, median, min, and max. |
| Components | Component Values can only be viewed for the value of the Number, Slider, and Rating components, as well as the character length of the Text input, Text Area, Markdown, and Code components. This will display the data belonging to each individual component's ID. Aggregation methods: Count, Sum, mean, median, min, and max. |
Breakdown
Defines the field used to break down and calculate the selected Measure(s).
| Breakdown (x-axis) | Parameter |
|---|---|
| None | — |
| Status | The item's current status. |
| Folder | The item's current folder. |
| Category | The item’s assigned category. |
| Approval status | The item's current approval status. |
| Custom metadata | The item's custom metadata, if any. |
| [Role_Name] name (Assignees) | Users with the specified role who have been assigned to items. |
| [Role_Name]name (Updated by) | Users with the specified role that have worked on the item in the editor. |
| Admin name | Users with the Admin role that have worked on the item in the editor. |
| [Role_Name] date (Action date) | A timestamp on when a user with the specified role last worked on the item in the editor. |
| Last action date | A timestamp on when the last action was taken on an item in the editor. |
| Components | Break down the data by the values of Select, Checkbox, Radio, Voting, Rating, Date, and Web component component options for each individual component's ID. |
The date format can be: Hour, Day, Week, or Month.
Compare by
Chart view gives you the ability to compare your metrics in a number of ways and display the differences clearly. The Breakdown parameters, excluding all date-related parameters, are available as Compare by parameters and are presented in alphabetical order in the graph.
Chart types
You can display the information using a number of different chart types: Bar chart (default), Stacked bar chart (available only if comparison is selected), Horizontal bar chart, Stacked horizontal bar chart (available only if comparison is selected), and Line chart (available only when the breakdown selection is [Role_Name] date, or Last action date).
Actions from chart
You can take actions directly from the chart to investigate a specific group of items without recreating its filters manually.
Click a bar, a section of a stacked bar, or a data point to:
- Open List — open the items represented by the selected chart value in List view.
- Zoom In — narrow the chart to the selected data and break it down by another parameter.
- Add to subset — add the items represented by the selected chart value to a subset.
Open List
Use Open List to inspect the items represented by a chart value in List view.
- Click the relevant value in the chart.
- Click Open List.
A new Explore tab opens in List view, narrowed down to the items represented by the selected chart value. The existing Folder, Subset, and query filters from Chart view are also preserved.
If a query is already applied, the new condition is combined with the existing query using AND.
For stacked charts, the generated query includes both the selected Breakdown and Compare by values. The selected Measure and its aggregation method do not affect the generated filter.
If Breakdown is set to None, List view opens with the existing Explore filters without adding a new query condition.
You can also Control / Command + click a chart value to open its corresponding items directly in a new List view tab.
When a user-based Breakdown displays Hidden user for shared-scope groups, that chart value cannot be selected.
Zoom In
Use Zoom In to investigate a chart value in more detail with another Breakdown parameter.
- Click the relevant value in the chart.
- Click Zoom In.
- Select the Breakdown parameter you want to use.
The Zoom In menu includes the available Breakdown parameters except the one currently applied.
The selected chart value is added as a query filter, while the selected parameter becomes the chart's new Breakdown. Existing Folder and Subset filters are preserved. If a query is already applied, the new condition is combined with it using AND.
For stacked charts, both the selected Breakdown and Compare by values are added to the query before the new Breakdown is applied.
If Breakdown is set to None, selecting Zoom In changes the Breakdown without adding a new query condition.
The chart type changes to the default chart type for the newly selected Breakdown parameter.
By default, Zoom In is applied in the current tab. To zoom in on a parameter in a new tab, use the following shortcut: Control / Command + click
Add to subset
You can add the items represented by a chart value to a subset directly from Chart view.
- Click the relevant value in the chart.
- Click Add to subset.
- Choose an existing subset, or create a new one.
- Click Add.
The items represented by the selected chart value are added to the chosen subset.
Chart view is not available when viewing a shared subset.
Sorting
You can sort the Measure parameters by highest-to-lowest, or vice versa. You can also sort the Breakdown parameter in alphabetical order, both regular and reversed.
You can only select one of these options at a time.
Download data
To download your data, click the download button in the top right corner. The download file is a CSV file which consists of a table with 2 columns if no comparison is selected.
- Column 1: Breakdown parameter
- Column 2: Calculation parameter + calculation method
The number of rows is equal to the count of breakdown parameters for each item.
If you have a comparison parameter selected, the downloaded CSV file is a matrix where the rows represent the breakdown parameters and the columns represent the comparison parameters.
The data in each cell of a matrix represents the calculation parameter + the calculation method for each item group of the (breakdown + comparison) parameter.
Bookmarks
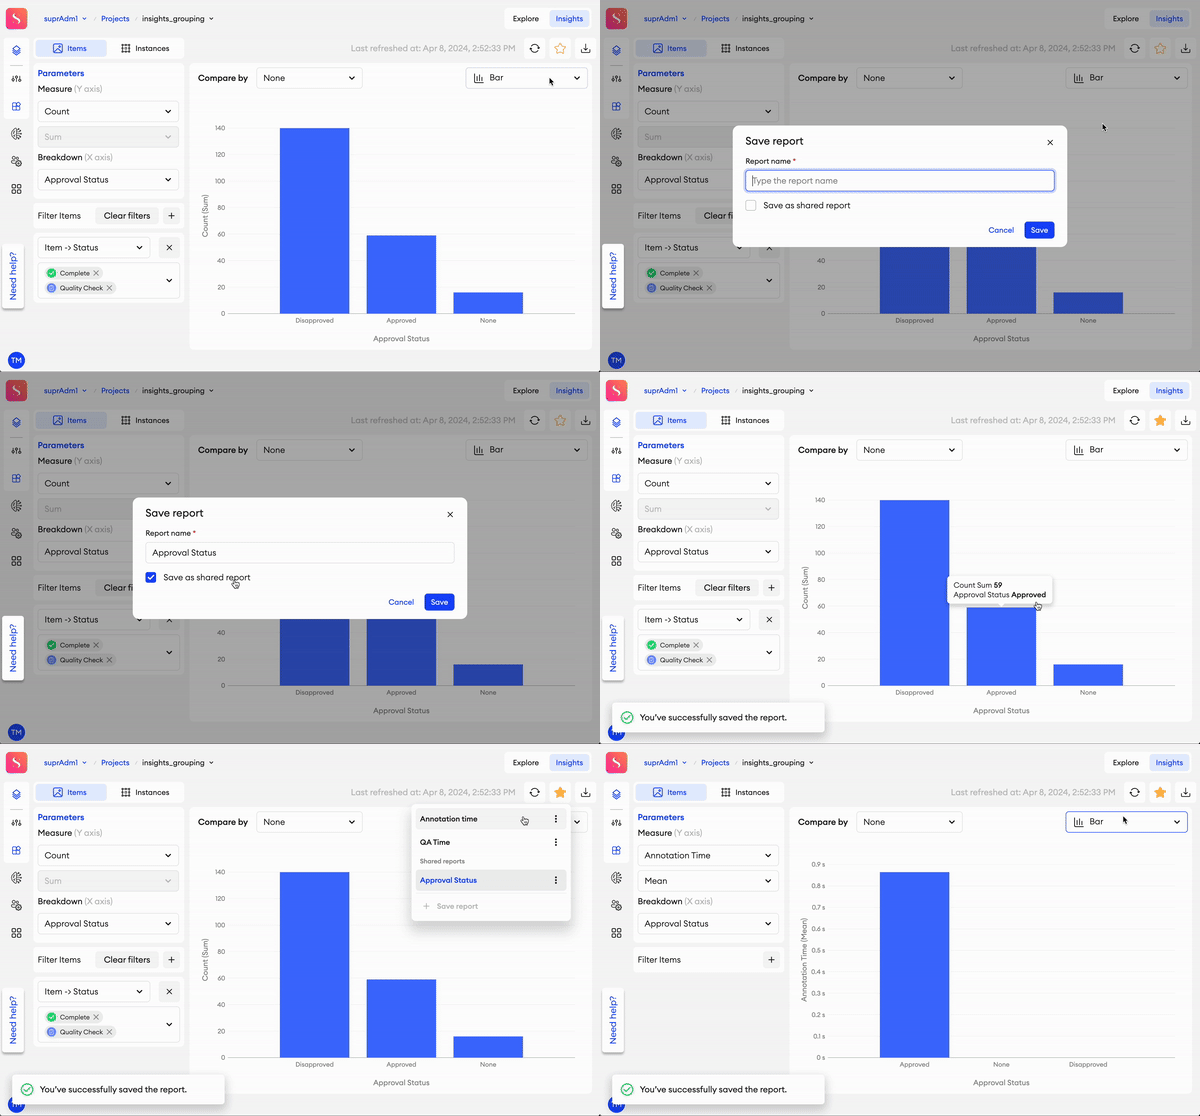
When visualizing your project’s data through the Chart view, you can save your Chart settings as a Bookmark. When clicked, a bookmark will apply all of its corresponding filters and preview parameters to save you time from doing it again manually.
To save a bookmark:
- In the Chart view tab, click on the Bookmark button.
- Type in a name for your bookmark.
- Check Save as shared bookmark if you want the bookmark to be visible to other admins (optional).
- Click Save.
Edit and delete bookmarks
You can edit or delete a bookmark at any time from its corresponding menu ⋮.
Team Owners and Team Admins can delete shared bookmarks regardless of who created them.
Updated about 1 month ago