
Team performance
This linear graph will help you track the performance of your team by displaying the individual progress and work pace of every member. This allows you to effectively follow-up on your team over the course of selected periods of time, as well as the time spent on the project.
You can choose to see your project data within specific time frames that cover days (D) or months (M). These can be selected from a list in the right panel: All time, Today, 7D, 30D, 3M, 6M, and Custom.
- This chart can be filtered by: Folder, Roles, and Users. Learn more.
- The Custom time frame allows you to select a starting and ending date.
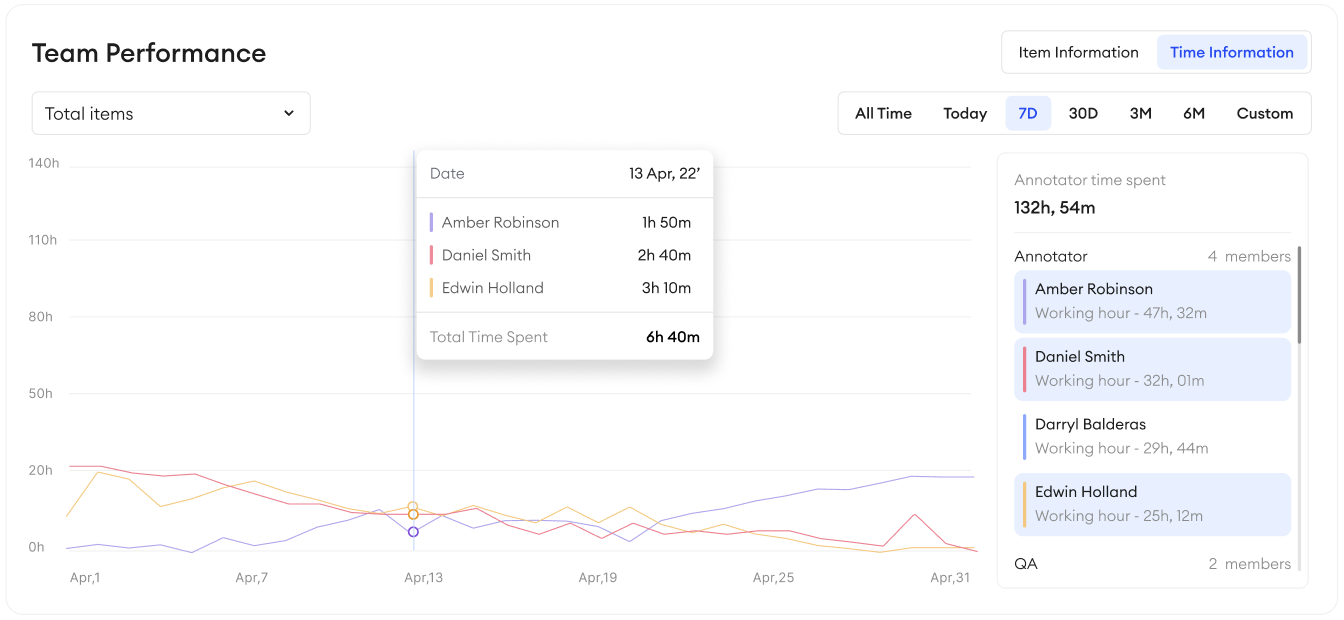
The team performance metrics are presented by two tabs: Item Information, and Time Information.
These tabs will allow you to see how many items contributors have worked on and how much time has been spent on the project.
You can also display information specific to users. To do so, select one or multiple users from the list to the right of the graph. Their information will appear as individual lines on the graph. Hovering over the lines displayed will show you the corresponding user and their information.
The users in this list are affected by the Roles filter.
Updated over 1 year ago