
Class distribution
This graph is a useful tool that allows you to monitor the distribution of classes across all items in a project.
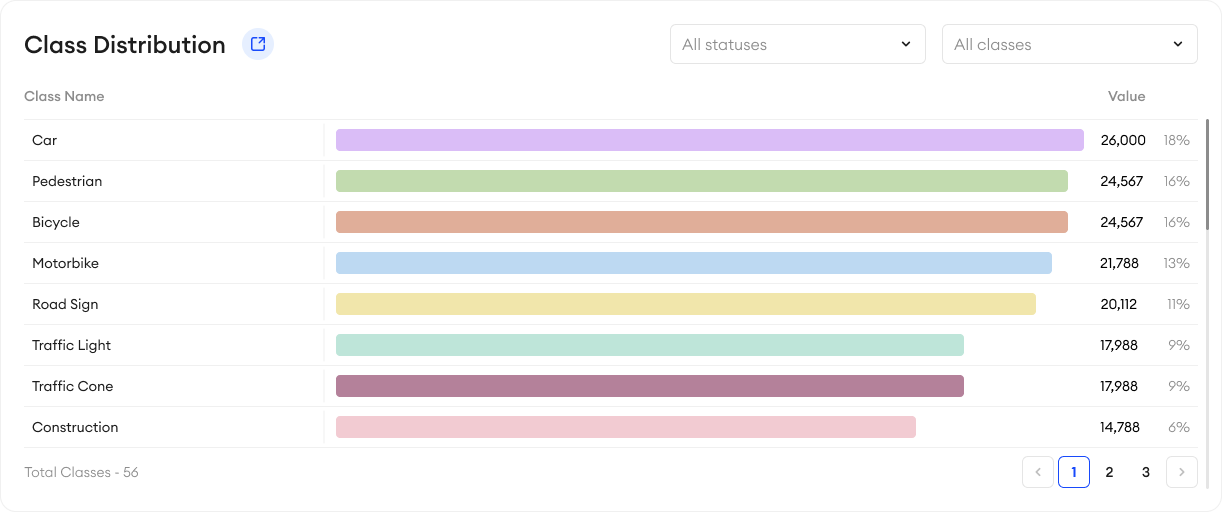
Each class is sorted descending from highest to lowest count. By default, the value shows how many instances each class has, regardless of item status. All instances without any classes are tracked by the Unclassified row. Any filters applied to the chart will also apply to these values.
In this section, by clicking on a class you can also see its Attribute Groups and Attributes displayed on the right side. These show you the usage count of each attribute group and any attributes they have, and their distribution across the project.
Your project’s analytics is linked to the curation tools in the Explore tab so that you can take any actions according to your findings directly, without having to manually query and filter them again.
The dropdown menus above the chart allow you to filter the classes in three ways: Folders, Item Status and Class Name. When filtering by class name, you can choose one or multiple classes.
This feature is unavailable for Multimodal projects.
Updated about 1 year ago