
Analytics overview
Analytics is a useful tool that can be found in the FineTune tab in the left panel. It can give you an in-depth look at your project’s performance so that you can monitor it more closely. There are a few different charts that can be filtered to best suit your needs. These charts can be found under: Status distribution, Team performance, and Component distribution.
At the top of the Analytics tab, you’ll see a quick project overview. From this section, you’ll be able to see the overall progress displaying how many instances have been created and how much time has been spent on the project.
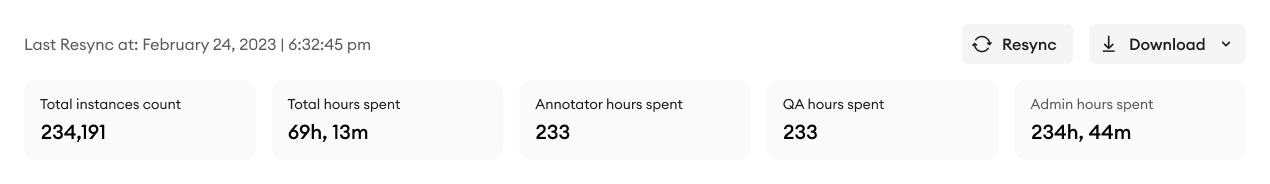
The overview shows information regarding instances and work hours:
- Total hours spent: Shows total hours spent on the project by all roles
- [Role_Name] hours spent: Total hours a user with any given role has spent working in the editor for this project. A separate card will appear for each individual role available and assigned to users in the project.
- Admin hours spent: Total hours the Admin(s) spent working in the editor for this project or folder (not visible to non-admin roles).
- Users with non-admin roles can only see the hours that they have individually spent in their current role. For example, an Annotator who has also worked on items as a QA can see the hours they spent as an Annotator only, because it is their current role.
- Grouped Contributors will only be able to see the analytical information of the data scope shared with their group.
Download reports
From the top of the Analytics tab, you’ll be able to download your project’s analytical reports.
To download a report:
- In the top right, click the Download button.
- Select a report: Status Distribution, Item Information, Time Information, Component Distribution, or Download All Reports.
Clicking an option will begin the download process. You’ll receive a CSV file with the option’s corresponding information.
Download All Reports will download one file that contains all reports.
Updated 6 days ago