
Monitoring
In the Monitoring tab, you can review every action that has been carried out by your automation and monitor them. The graph displays the various metrics of your automation pipelines, and it can also be filtered to highlight any specific information you’re looking for.
You can click on a pipeline to examine it using this tool.
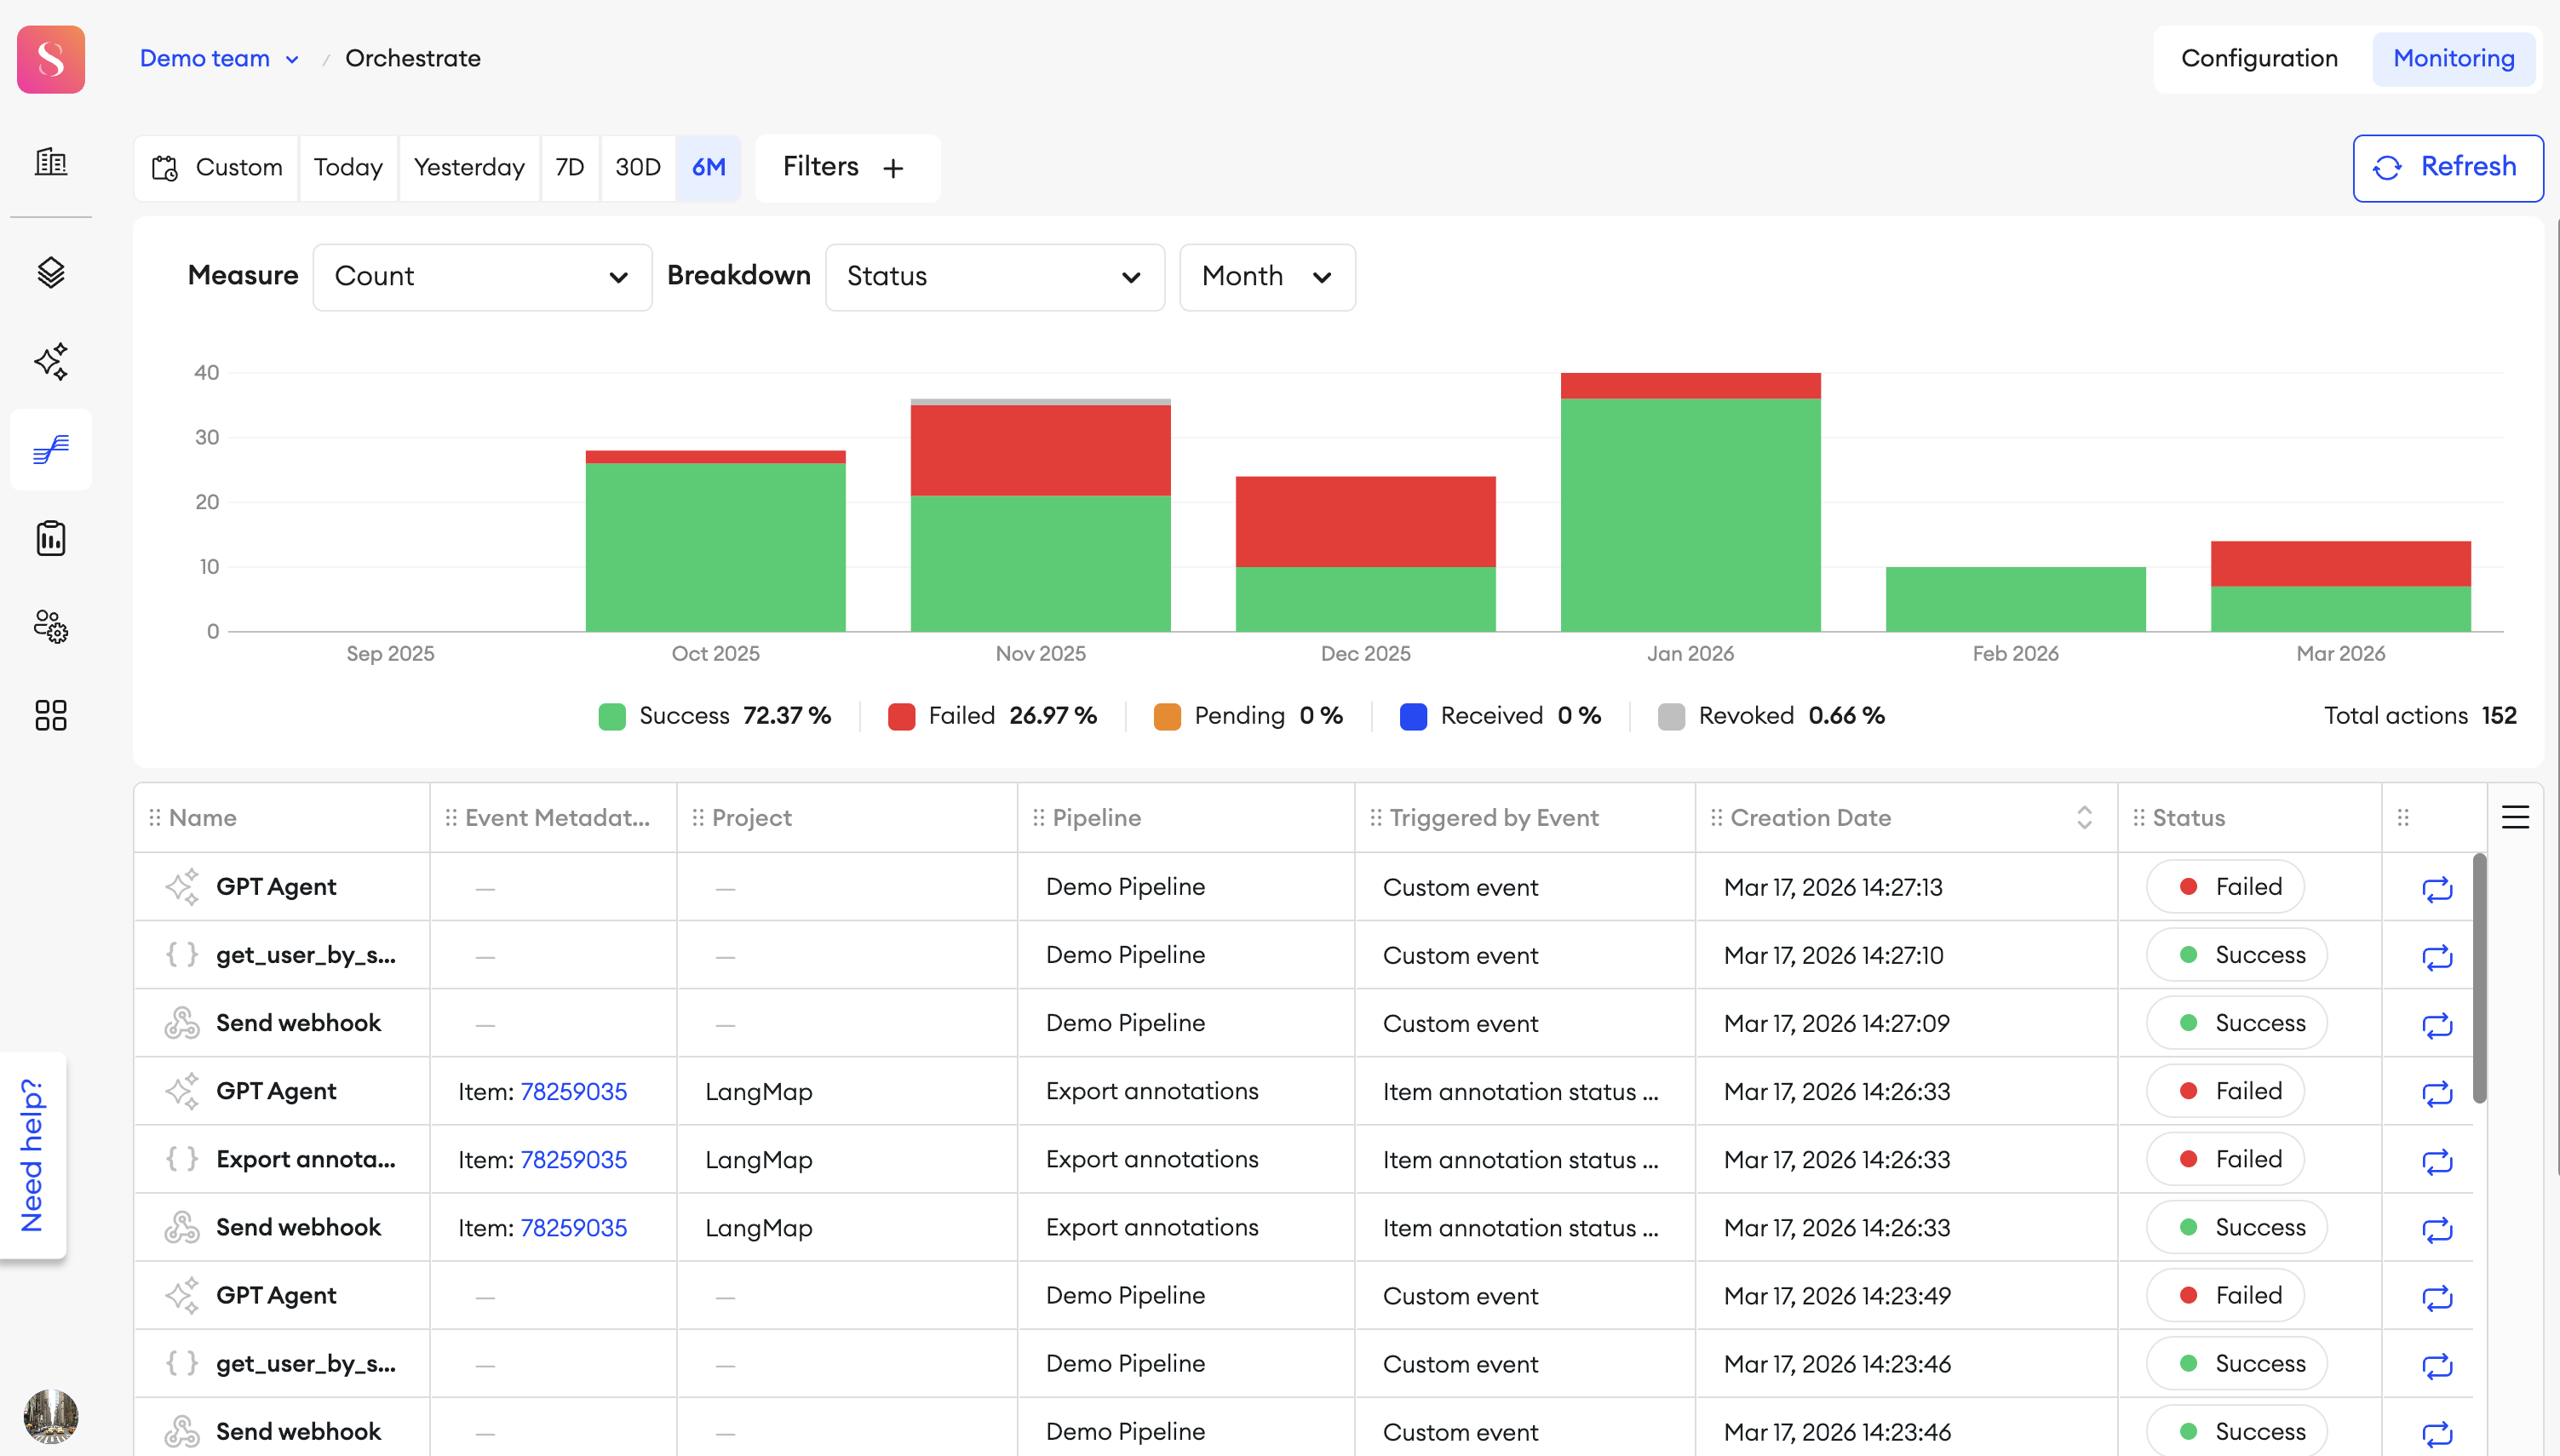
On this chart, you can see the data of all actions that have taken place across all your pipelines in your team, displayed across a timeline. You can modify the time frame to look at the data in smaller or larger scales. You can also filter by pipeline to look at data only for specific pipelines.
Chart parameters
The monitoring chart can be given parameters to help you examine your pipelines in detail:
- Breakdown - You can view your chart’s data by Status, Action or Agent, Event, Project and Pipeline. Depending on the selection, you'll see the percentage of each status below the chart, with the total number of actions or events shown in the bottom right corner.
- Status - You can view your actions by status, and you can select multiple at once.
- Event - You can have the graph display action data based on the event that triggered it.
- Action or Agent - You can select both default or custom actions to see their details on the graph. For custom actions, you can select them by name from the dropdown list.
- Project - You can have the data display the projects in which your pipeline has been triggered.
- Pipeline - You can have the data display the pipelines in which your actions have been triggered.
- Measure - You can show the data based on Count and Computation time.
- Time units - Aggregates the chart data by the selected unit:
- Second - Available for windows under 5 minutes.
- Minute - Available for windows under 3 hours.
- Hour - Available for windows under 7 days.
- Day - Available for windows under 90 days.
- Month
Filter methods
There are a couple of methods you can use to filter both the Monitoring chart and the table below.
Date and Time
You can also filter the data by date and time using the date picker above the chart:
- Custom - Shows all data available within a range of dates that you select. This time frame can only be within the past six months.
- Today - Shows all data available from all hours of the current day.
- Yesterday - Shows all data available from all hours of the previous day.
- 7D - Shows all data available from the past seven days, with each day separated into 00:00 and 12:00 time blocks.
- 30D - Shows all data available from the past thirty days in 2-day increments.
- 6M - Shows all data available from the past six months.
The graph will show you data from Today by default.
You can also click and drag over bars (days, months) on the chart to select a specific and smaller time frame to zoom in on the details within the selected time.
Filters
You can use filters to display your members based on specific criteria that you can set with the use of operators. You can revert these filters at any time by clicking the Reset filters button at the top.
Add filter options
To add a filter option:
- In Monitoring, click on the
Filters +icon in the right panel. - Select the filters you want to add from under their respective headings:
- Name
- Triggered by event
- Status
- Pipeline
- Project
- Click Apply.
Filter options
These are the filter options available, and what operators you can use for them:
- Name:
- Option: You can select one or multiple options, either individually or by option type (default action, custom action, agent).
- Triggered by event:
- Options: You can select one or multiple events, either individually or by event type.
- Status:
- Options: You can select one, multiple, or all statuses.
- Pipeline:
- Operator: is, is not.
- Options: You can select one or multiple pipelines.
- Project:
- Operator: is, is not, is empty.
- Options: You can select one or multiple projects.
List of actions
Columns
Below the graph, you can see the information of every regular action or agent action laid out in a list with a handful of columns:
- Name - The name of the action or agent.
- Details - The action’s description.
- Pipeline - The pipeline in which the action was triggered.
- Project - The project in which the action was triggered.
- Triggered by Event - The name of the event triggering the action.
- Event Metadata ID - The ID of the project, folder, or item that triggered the action.
- Creation date - The date that the action was created.
- Status - The current status of the action.
- Actions - Column where you can rerun or revoke action.
There are various ways you can manage your columns:
- Resize - Click and drag the edge of any column to resize.
- Freeze - To freeze a column in a static position on the left side of the table, hover over the column and click the Freeze icon in the header.
- Move - Click and drag the header of any column to move and reorder it.
- Sort - You can click the up or down arrows on a column's header to sort its corresponding data by ascending or descending order, respectively. By default, the table is sorted by Creation Date.
If you Resize, Freeze, and Move your columns, the state of your Pipelines table will be saved for you. Any time you refresh or revisit the Pipelines table, it will maintain your latest changes.
From the Column menu ☰, you can select and deselect columns to toggle their visibility on the table. As well as this, you may create Custom Columns to display custom metrics that you can apply to projects.
Who can see your modifications?Any modifications you apply to the table in this way will only be visible to you.
Rerun and Revoke
If a previously executed action’s status is Success, Failed, or Revoked, you can click the Rerun button to rerun it with its original payload. It’ll also run all subsequent nodes of the action or agent. As an example, if the action had custom arguments added to the event object, the action will be rerun using its original custom arguments. If the agent’s prompt was edited, the agent will rerun using its original prompt.If the agent’s parameters were edited, the agent will rerun using its original parameters.
The only exception is that if the action’s code was edited or a secret updated, the action will be rerun using the new updated code and secret.
Rerun is unavailable for disabled pipelines, for deleted actions or agents, and for nodes removed from the pipeline.
If an action is Pending or Received, you can click the Revoke button to stop it from being carried out.
You can click on an action to open a drawer menu with all of its corresponding data. The details are dependent on either:
- the action type (Custom, Webhook, or Email)
- the agent
From the top right corner of this menu, you may choose to view the action in its corresponding pipeline. For custom actions, you may also open them in the code editor directly from the menu.
Action statuses
An action can have one of these statuses:
- Received - this shows when the action has been received by the system but it isn’t in progress yet.
- Pending - this shows when the action is in progress.
- Success - this shows when the action was carried out successfully.
- Failed - this shows when the action failed to be carried out.
- Revoked - this shows that the action was revoked before it could be carried out.
Agents
- Details - This tab shows the agent’s corresponding parameters, including the model prompt.
- Chain - The chain of triggers leading to the selected agent.
- Input - The prompt given by the user.
- Output - The model’s response, written in SuperAnnotate’s JSON format. If the model fails, the output will contain the error message in the same format. For advanced prompts, if the JSONPath has a missing value or the key doesn’t exist, the output will contain an error text message.
- Traces - This tab shows the tool calls that were made by the agent using the SuperAnnotate MCP tool. It displays the request and response payloads for each agent’s tool call.
Traces LimitationsOlder traces are automatically deleted after 14 days as part of our data retention policy.
Custom action

- Details - This tab shows the action’s corresponding data based on its configuration. This includes the action’s status, secret, custom arguments, description, and its creation, start, and end dates.
- Chain - The chain of triggers leading to the selected action.
- Input - The event JSON and a context object.
- Output - The output JSON, text or traceback.
- Logs - The custom action’s logs, available so that you can closely monitor the automations and troubleshoot any given errors.
Log limitations
- If the log file size exceeds 1MB, it will be truncated to display only the most recent 1MB of entries.
- Older logs are automatically deleted after 14 days as part of our data retention policy.
Webhook

- Details - This tab shows the action’s corresponding data based on its configuration. This includes the status, URL, secret, and its creation, start, and end dates.
- Chain - The chain of triggers leading to the selected action.
- Request - The corresponding request headers and payload.
- Response - The corresponding response headers and payload, as well as the status code.
Email

- Details - This tab shows the action’s corresponding data based on its configuration. This includes the status, email, and its creation, start, and end dates.
- Chain - The chain of triggers leading to the selected action.
- Email body - The event that took place, and what it was triggered by, will show in this tab.
All action types have creation dates, but the start and end dates depend on the status of the action.
Updated 4 months ago