
Analytics
Analytics is a useful tool that can be found in the FineTune tab in the left panel. It can give you an in-depth look at your project’s performance so that you can monitor it more closely. There are a few different charts that can be filtered to best suit your needs. These charts can be found under: Status distribution, Team performance, and Component distribution.
For more information about the Analytics tool, take a look at the Analytics overview.
Component Distribution
This chart provides a helpful way to view the distribution of components across your Multimodal project. It can be filtered by Status, and Component, and it takes into account the overall Folder filter.
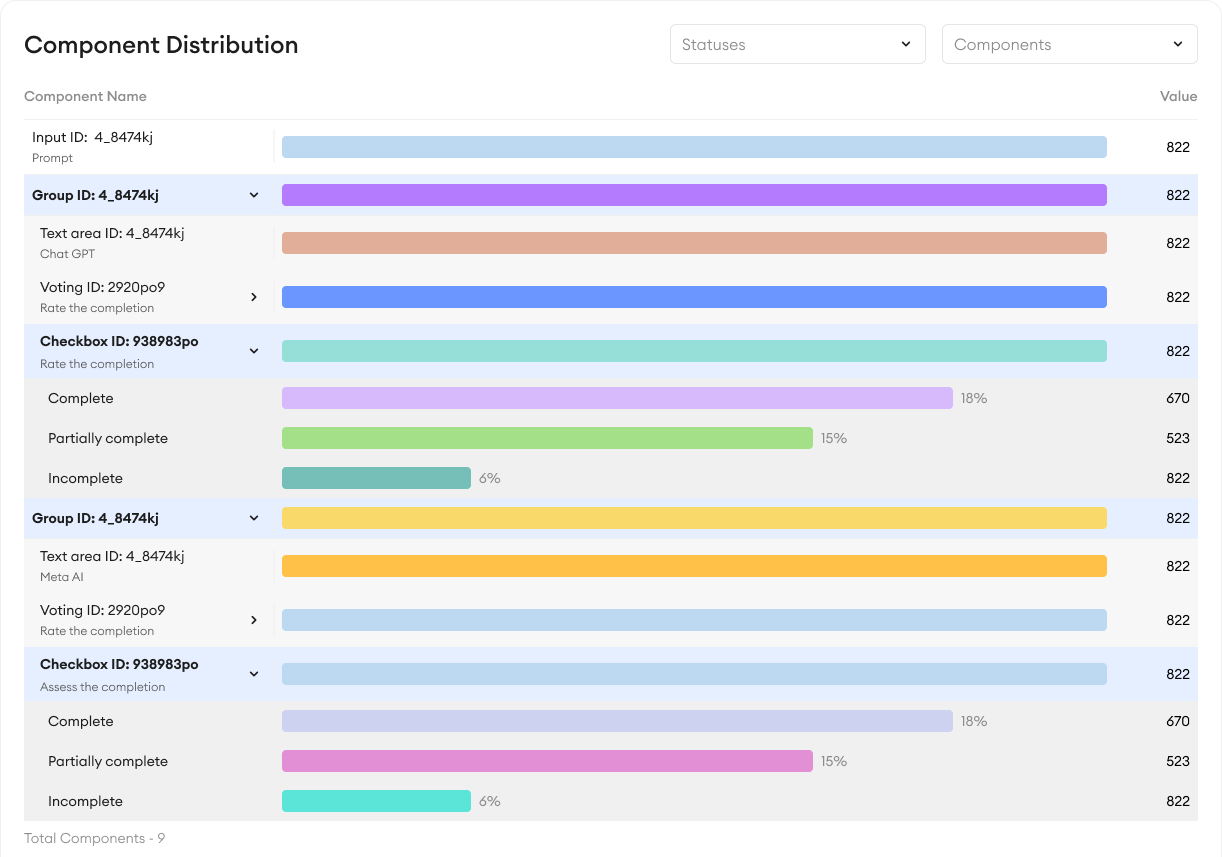
The components used in your project are displayed with their respective values and properties.
You can find all components under Component Name, with their name and corresponding ID. Components that have multi-option properties can be expanded to show the frequency of each option selected by percentage. Groups can be expanded to show components that are stacked within.
Download reports
You can download your Analytics reports of your Multimodal projects. Learn more.
Updated about 2 months ago